


We’ve partnered with Optibase to bring disciplined experimentation and trustworthy conversion tracking to Webflow builds for B2B SaaS teams. This article explains why it matters, what you get, and how we run CRO programs end-to-end.
Why We Partnered with Optibase
We chose Optibase because it integrates the testing mechanics teams need with the operational guardrails CMOs expect. It makes experimentation part of everyday site operations rather than a side project.
The gap we saw
Most teams struggled to connect page changes to controlled experiments and conversion outcomes after launch. Testing lived outside the build process, which slowed learning and raised engineering overhead.
- Teams needed structured, Webflow-native tests, not ad-hoc checks.
- Post-launch learning lagged because data and testing weren’t integrated.
- Programs stalled whenever changes required developer bandwidth.
What Optibase solves
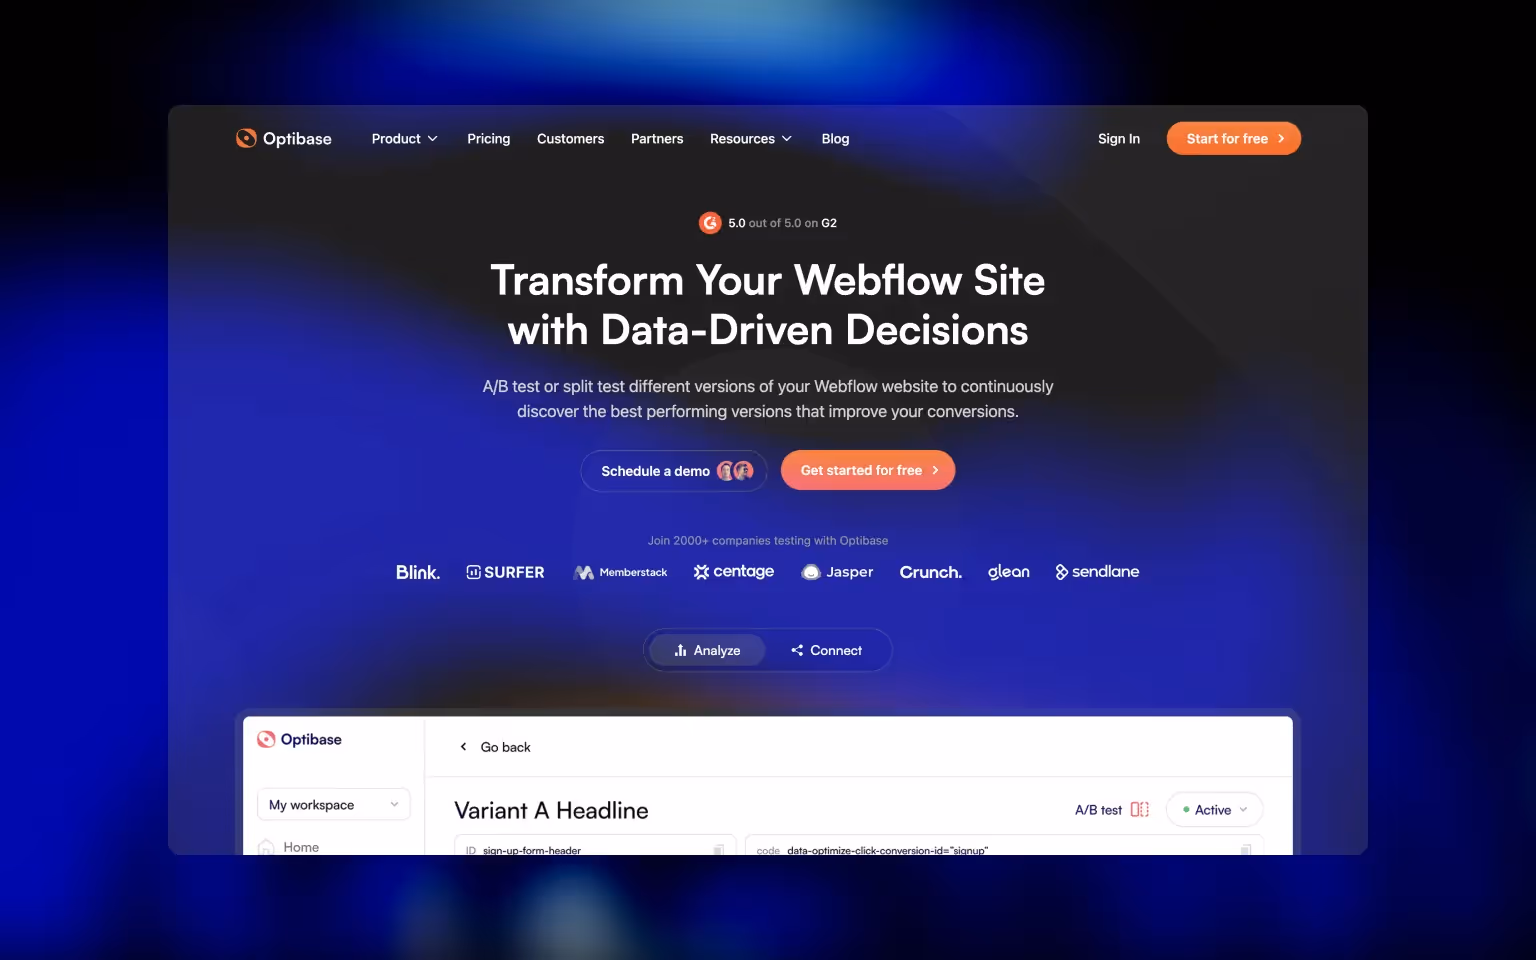
Optibase brings A/B, split, and multivariate testing into your Webflow workflow and pairs it with flexible conversion tracking. You get better decisions, faster, without UX flicker or performance trade-offs. Implementation is seamless with our Webflow development agency.
- A/B, split, and multivariate testing with planned variants and clear goals.
- Conversion tracking for clicks, form submits, page views, time on page, and scroll depth.
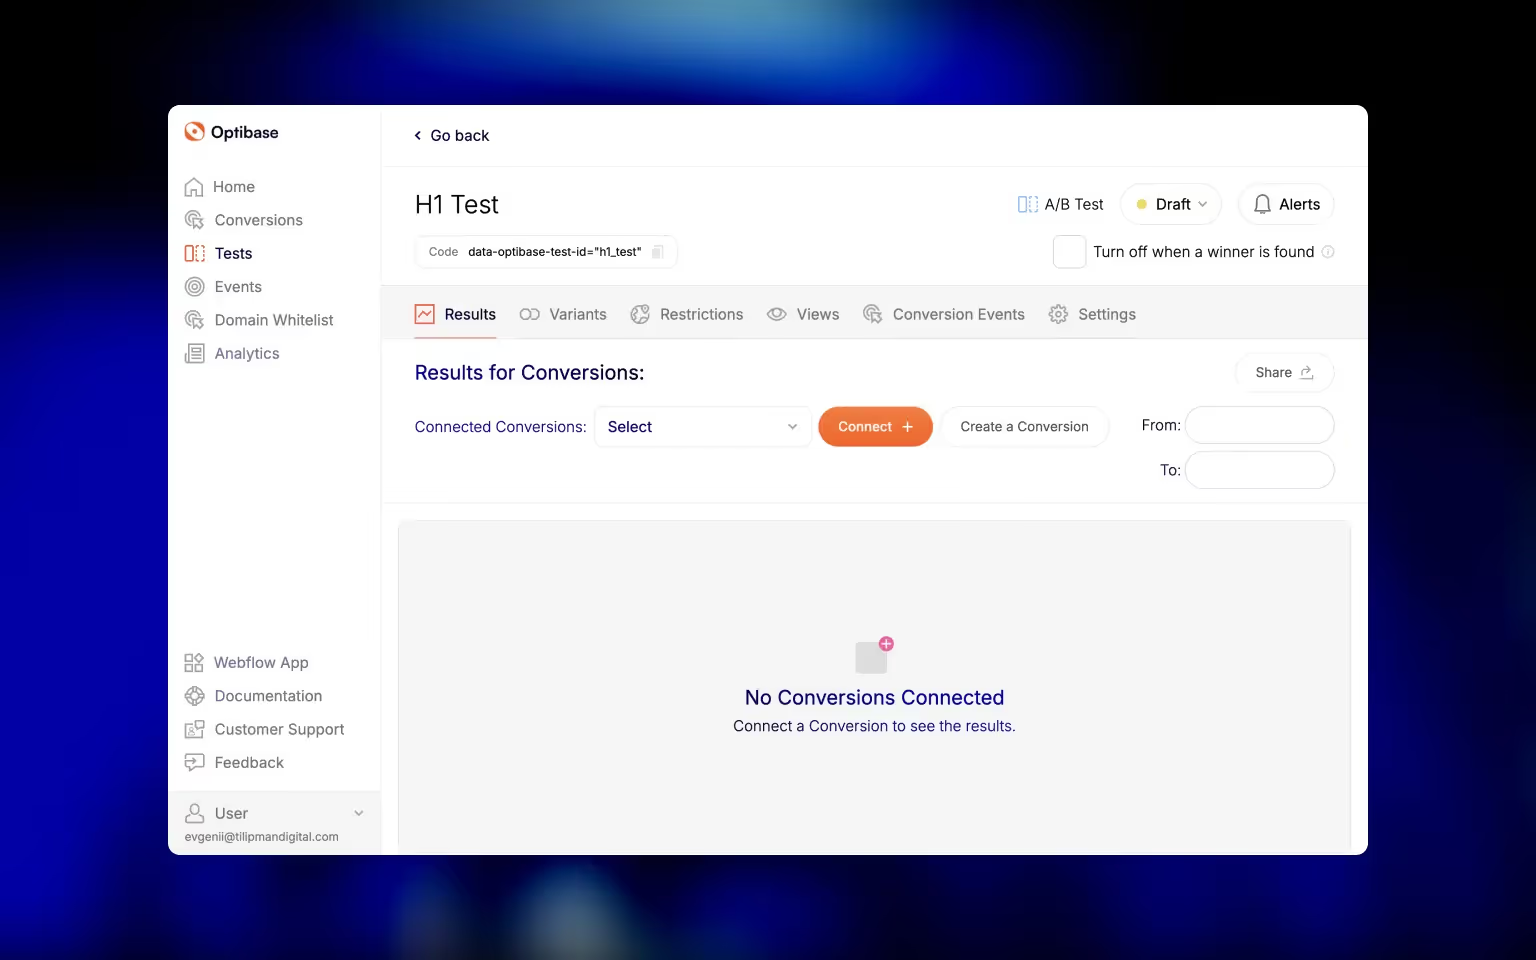
- Dashboard to plan, monitor, preview, and export CSVs (analytics & reporting “coming soon”).
- Controls & quality: segmentation (location, screen size, OS, browser), traffic allocation, cross-domain, preview variants, no flicker, and P2BB Bayesian reads.
- Integrations: GA4 auto-detect, HubSpot forms, optional server-side conversions.
Why this matters to CMOs and founders
You get a faster cycle between insight and change, with less dependency on engineering. Most importantly, you see clearer signal on what truly moves demo requests, trials, and revenue.
- Shorter iteration loops and transparent roadmaps.
- Ownership of testing cadence within marketing.
- Decisions backed by practical statistics (P2BB), not guesswork.
Continuous improvement is key to driving better results from your website. As highlighted in our B2B website strategy guide, ongoing optimization is vital. Our Optibase partnership equips us to continually test and refine websites for maximum growth.
We started the Optibase Partner Program because website owners have limited options for A/B testing. Our partners bridge that gap — helping businesses understand their choices, introducing Optibase as a powerful CRO solution, and driving both strategy and execution.
Tilipman Digital was among the first to join and has already seen strong results helping customers grow through CRO. With deep expertise in testing and optimization, our partners ensure businesses aren’t just testing — they’re improving.— Sergej Gorišek, Co-Founder @Optibase

What You Get From This Partnership
This section outlines the capabilities, engagement model, deliverables, and outcomes you can expect. Everything is geared to measurable pipeline impact.
Core capabilities
You’ll have the tooling and workflows to test confidently across the pages that matter most. Our team implements variants cleanly and ensures tracking is airtight.
- A/B, split, and multivariate testing for pages and components in Webflow.
- Conversion tracking for demos, trials, pricing CTAs, forms, scroll depth, page views, and time on page.
- Dashboard to plan tests, monitor progress, preview variants, and export CSVs; GA4/HubSpot support and server-side conversions.
Engagement model
We operate on quarterly roadmaps calibrated to your pipeline goals. The cadence balances flagship tests with iterative quick wins.
- Quarterly roadmap aligned to activation, PQL/MQL, SQL, and revenue.
- Cadence: one flagship test per month plus quick wins.
- Readouts with clear decisions: ship, iterate, or retire.
Deliverables you can expect
Every experiment ships with a brief, guardrails, and a clear definition of success. After each run, we publish the readout and next steps.
- Hypotheses, success metrics, sample-size/duration estimates.
- Variants (copy, layout, components) implemented cleanly in Webflow. When bigger layout shifts are required, our B2B web design agency can deliver test-ready designs.
- Post-test analysis with prioritized backlog.
Outcomes to target
We focus on conversion points that tie directly to pipeline and revenue. Expect steady, compounding improvements rather than sporadic big swings.
- Higher demo or trial conversion.
- Smoother form completion and onboarding.
- Clearer comprehension of pricing and packaging.
Where Experimentation Moves the Needle
Not all pages are equal. Here are the areas that typically produce meaningful lifts fastest for B2B SaaS.
High-impact areas
Each of these surfaces common friction and trust gaps. Testing here often yields outsized returns.
- Pricing: structure, plan copy, comparison tables, risk reversal, toggle defaults. See winning patterns in our pricing page examples article and test them with Optibase.
- Demo/Trial: CTA framing, proof near CTAs, field reduction, single vs multi-step.
- Navigation: IA, sticky CTAs, signposting to primary actions. Use our SaaS navigation playbook to scope tests before shipping.
- Product Pages: value props, feature order, social proof density.
- Blog → Pipeline: inline CTAs, content upgrades, exit intents.
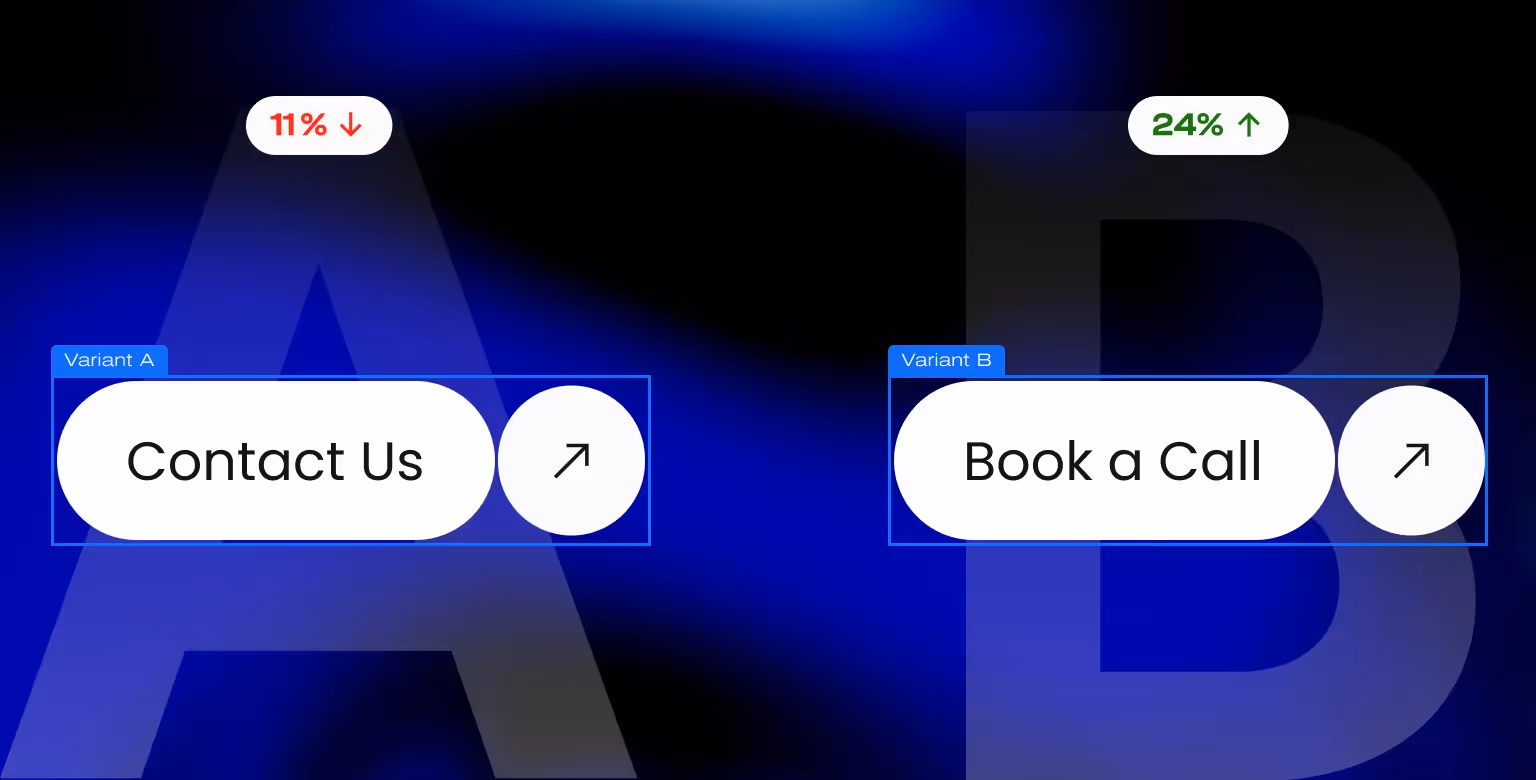
Example experiment types
Use these patterns to prioritize. They’re simple to execute and easy to measure.
What we do before launching a test
Preparation prevents false reads and rework. We scope the problem, the lift we need, and the time required to detect it.
- Define the user problem with conversion data and journey review.
- Draft hypothesis, primary metric, and minimum detectable effect.
- Estimate traffic, duration, and stopping rules.
Our Process
This operating model keeps experimentation predictable and decision-oriented. It also scales without adding engineering overhead.
- Align on goals and constraints — Map visit → engage → qualify → convert and choose a single primary outcome for the quarter.
- Diagnose friction — Review conversion tracking, key page journeys, and qualitative inputs from sales and support.
- Prioritize hypotheses — Score by impact, confidence, and effort; pick one flagship test plus quick wins.
- Design and implement variants — Draft copy/layout in Webflow, preview variants, confirm tracking, and QA.
- Run tests with guardrails — Pre-set success metric, duration, and stopping rules; manage traffic allocation and segmentation.
- Read, decide, and iterate — Ship the winner or iterate; log decisions and feed learnings into the next cycle.
Implementation guidance for installing and configuring Optibase in Webflow is covered in a separate development guide.

Measurement, Guardrails, and Governance
We measure what matters, protect data integrity, and document decisions so progress compounds over time.
Metrics we track
Primary metrics reflect commercial intent, while secondary and quality metrics help validate durability.
- Primary: demo requests, trial starts, qualified lead rate. For accurate form attribution, follow our Webflow–HubSpot integration guide.
- Secondary: CTR to key pages, form completion rate, time to first value.
- Quality: downstream opportunity rate and close rate where available.
Statistical guardrails
Good statistics reduce noise and protect confidence. We plan detection thresholds and avoid mid-test bias.
- Pre-calculate sample size and duration.
- Avoid peeking and metric-swapping mid-run.
- Use Probability-to-Be-Best (Bayesian) for practical decisions when effects are close.
Data integrity and SEO safety
Experiments should never harm crawlability or speed. We keep setups clean and reversible.
- Stable URLs, no cloaking, correct canonicals.
- Performance budgets and no-flicker behavior.
- Cross-domain tracking when flows span properties.
Reporting and accountability
Clear records accelerate future wins. We keep one source of truth and export data for deeper analysis.
- Unified dashboard plus CSV export.
- Decision logs per test: hypothesis, result, action.
- Quarterly summaries of wins, losses, and durable learnings.
Proof and Example Scenarios
These examples show common patterns and the outcomes you should expect to measure. Actual impact depends on audience, offer, and traffic.
Pricing page clarity
Focus the choice and reduce indecision. Many teams see quick gains here.
- Hypothesis: clearer plan labels and a focused “most popular” state reduce hesitation.
- Variant: simplified plan names, tighter rows, proof near CTAs.
- Outcome: click-through to signup or demo from pricing.
Demo form completion
Shorter, clearer flows convert better. Test structure before microcopy.
- Hypothesis: progressive disclosure reduces cognitive load.
- Variant: split long form into two steps, add helper text near sensitive fields.
- Outcome: completion rate and qualified percentage.
Trial start intent
Messaging clarity drives action more than style tweaks.
- Hypothesis: value-based CTA copy increases intent.
- Variant: "Start free trial" vs "Build your first workflow," with supporting microcopy.
- Outcome: trial starts and first-session retention.
Navigation focus
Reduce choice to increase action on primary goals.
- Hypothesis: fewer competing links lift clicks to the primary action.
- Variant: streamlined nav with one primary action, secondary links in a menu.
- Outcome: CTR to target page and downstream conversion.
Work With Our CRO Team
We tailor the cadence and scope to your traffic, goals, and team capacity. Start small, prove lift, then scale what works.
Share goals and constraints, and we’ll propose a 90-day testing roadmap with metrics and guardrails. We align definitions, tracking, and success thresholds before the first run.
When you are ready, speak with our conversion rate optimization experts to plan your first testing cycle.
FAQ on Optibase and our Partnership
What is Optibase?
Optibase is a Webflow-specific testing app for A/B, split, and multivariate experiments, with conversion tracking and a no-code dashboard.
Do we need to migrate our site?
No. Install Optibase from the Webflow App Marketplace and connect it to your existing project.
Does Optibase support multivariate tests?
Yes. You can run multiple combinations, but MVT needs more traffic for meaningful reads.
How do you avoid performance or UX issues?
Optibase avoids flicker and is designed not to impact page performance. We keep variants within performance budgets.
Can we track HubSpot forms and GA4 events?
Yes. Optibase supports HubSpot form tracking, auto-detects GA4, and can accept server-side conversion events.
How long should a test run?
It depends on traffic and the minimum detectable effect. We calculate sample size and duration up front, and many tests run at least two weeks.
What if our traffic is low?
We target higher-impact pages, broaden sensible success metrics, and use sequential testing to build signal.
Can we export the data?
Yes. You can export CSVs for deeper analysis and reporting.
What’s available in the dashboard today?
You can plan and track tests, preview variants, and view conversions with CSV export. Analytics and reporting modules are marked “coming soon.”